Stop Budget Surprises and Consultant Coordination Chaos
Track every dollar in real-time. Unify consultant workflows. Visualize assets with regulatory context. Manage 50+ wells without spreadsheet chaos.

Overview
When operations managers oversee 50 wells across multiple contractors and sites, complexity multiplies fast. Consultants submit costs through email. Finance discovers overruns when invoices arrive two weeks late. Different contractors track time in different systems. Project status lives in spreadsheets. Matidor unifies field operations, project management, and budget tracking into one platform built for oil and gas complexity. Real-time visibility replaces month-end surprises. Geographic visualization shows assets with regulatory context. Centralized workflows replace email chaos.
Trusted by Oil and Gas Teams Across North America
.png)


What Budget Overruns, Consultant Chaos, and Geographic Blindness Actually Cost You
Industry Problem 1
Budget Overruns Arrive with the Invoice
Your AFE approval process is solid. Your cost tracking is not.
Field consultants work for days before submitting timesheets. Those timesheets enter accounting, then wait for month-end processing. By the time you see actuals exceed budget, that consultant already billed you 20% over limit.
Traditional accounting systems process expenses backwards. By the time finance compiles the month-end report, decisions are locked and overruns are facts.
Industry Problem 2
Consultant Workflows Create Consolidation Chaos
Your firm hires specialized consultants for different project phases. Each brings their own workflow, tracking system, and communication style.
One consultant submits daily timesheet emails. Another uses a standalone time-tracking app. A third tracks hours in spreadsheets. Someone spends two days each month consolidating these into consistent cost reports.
Documentation gets scattered across email, shared drives, consultant laptops, and accounting systems. When consultants leave mid-project, their files go with them.
Industry Problem 3
Asset Information Lives Separately from Operations
When you manage 50 wells across two regions, spreadsheets hide the geographic and regulatory reality. Asset locations tracked in one system. Well disposition in another. Regulatory zones in GIS files. Right-of-way information somewhere else.
You can't see wells with their regulatory context. Planning happens without complete spatial awareness. Consultants work without visibility into surrounding infrastructure or jurisdictional boundaries.
How Matidor solves these problems
Real-Time Visibility, Unified Workflows, and Geographic Intelligence
Unlike spreadsheets and accounting systems that show budget data 5-7 days late, Matidor tracks spending in real-time as it happens. Unlike email-based workflows that scatter information, Matidor centralizes everything in one searchable platform. Unlike office-only tools, Matidor works 100% offline for remote field operations.
.avif)
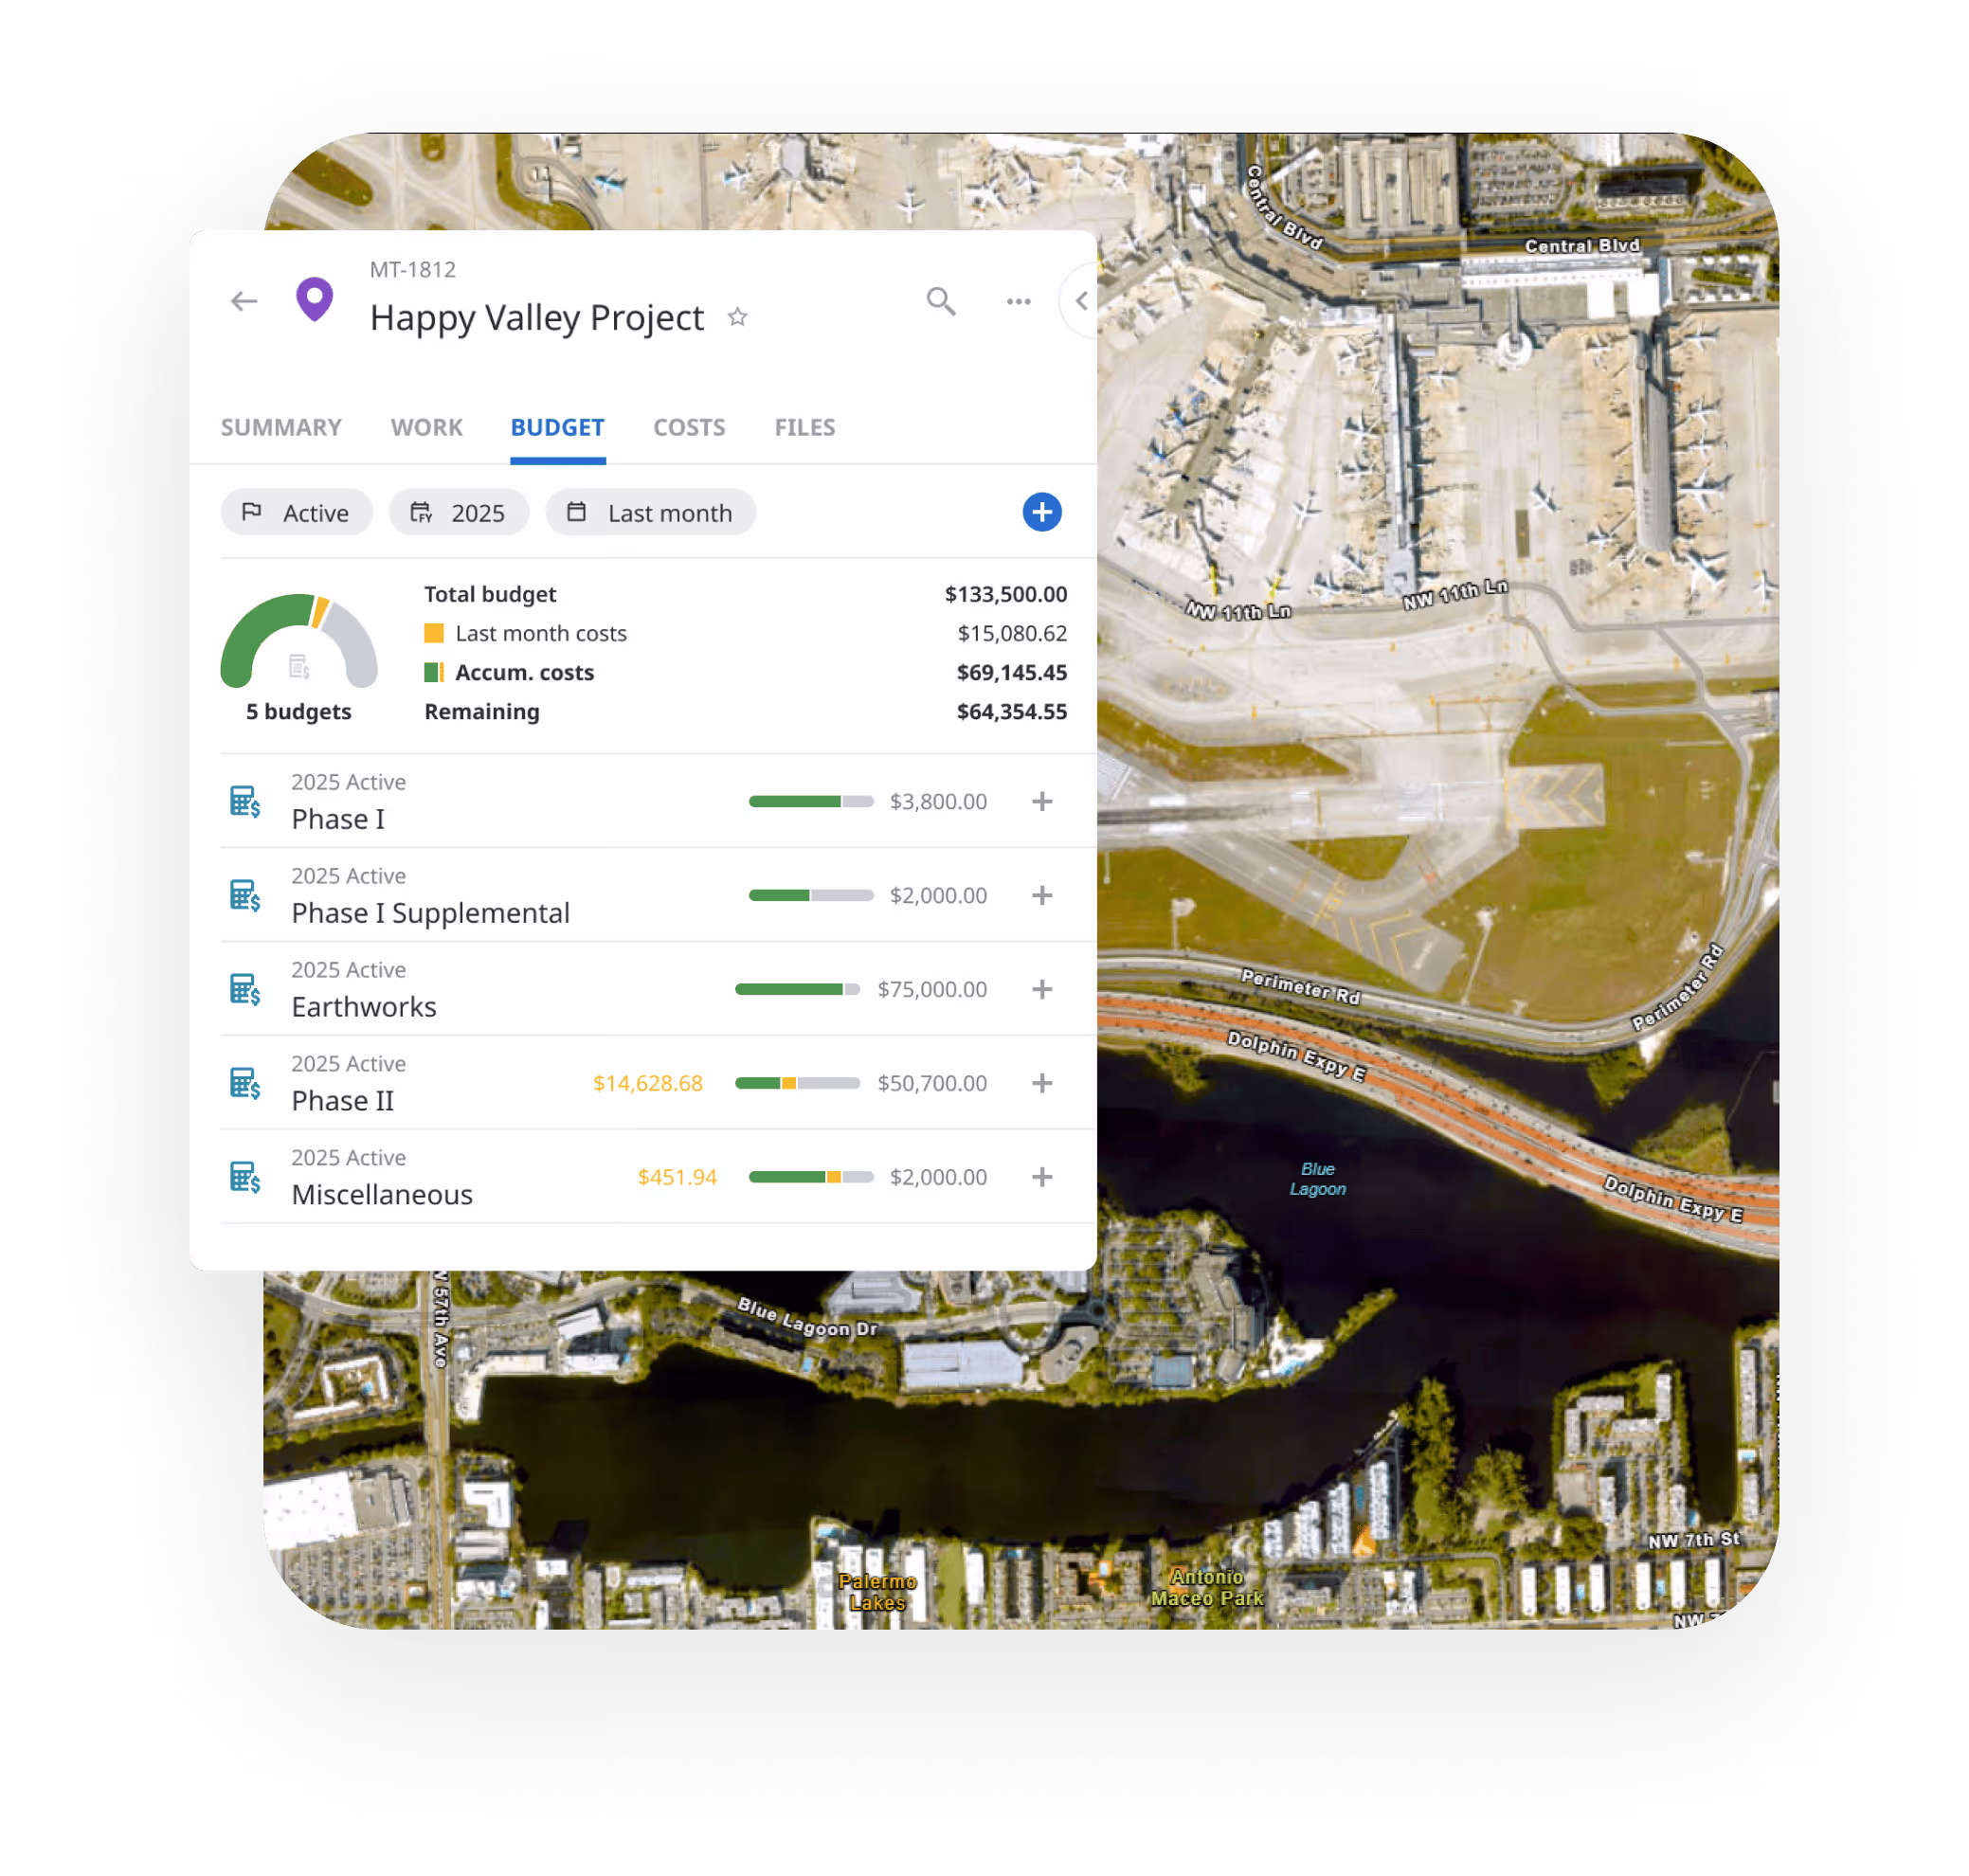
Real-Time Budget Tracking Prevents Overruns
Track every dollar as consultants log time and equipment costs. Budget alerts trigger automatically at 70%, 90%, and 100% thresholds, giving you time to adjust before overruns lock in. Month-end close drops from days to minutes with automated accrual reports.
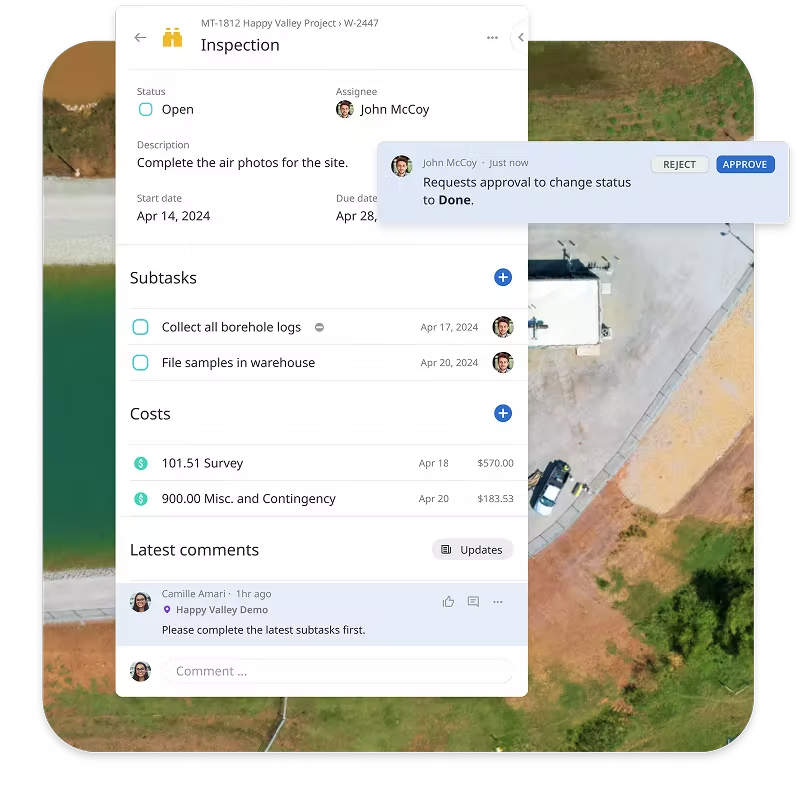
Unified Consultant Workflows Replace Email Chaos
All consultants work through the same platform using standardized mobile forms. Timesheet entries, expenses, and progress updates flow into one centralized database. Zero time spent consolidating different formats from different contractors.

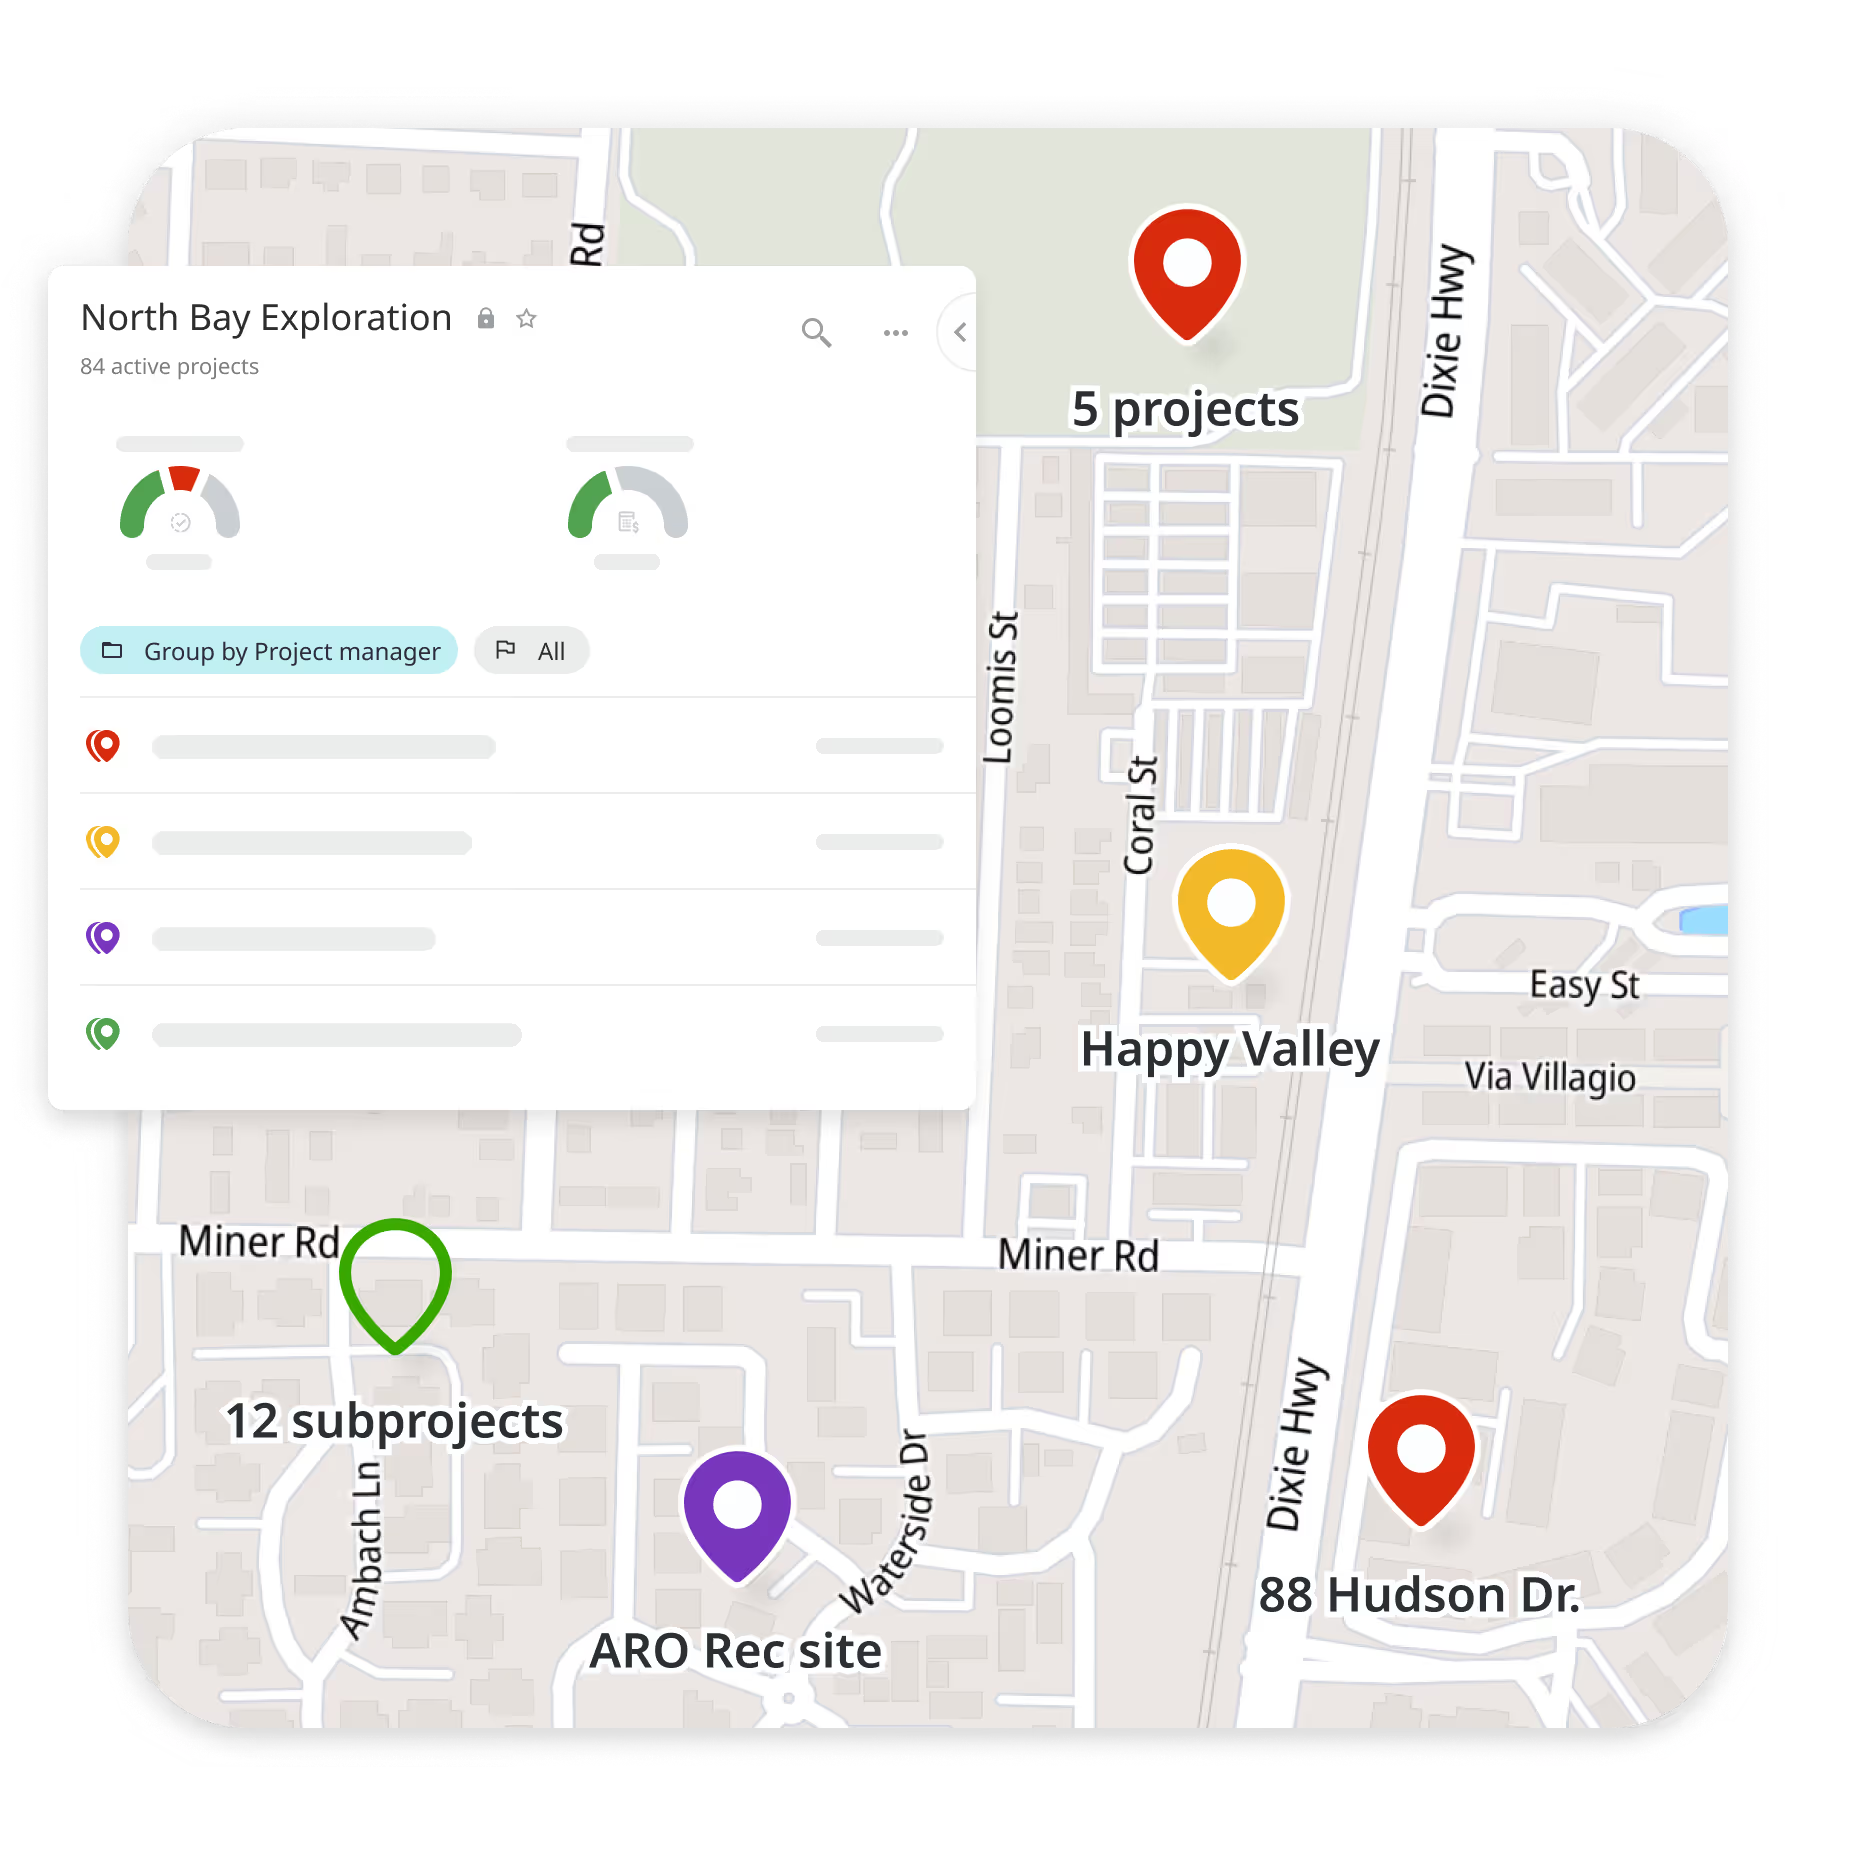
Visualize Assets and Critical Information Geographically
All wells, facilities, and pipelines display on interactive maps with multi-layer visualization. Overlay asset disposition, regulatory zones, right-of-way corridors, and compliance areas on one map. See site locations with complete geographic context including surrounding infrastructure, environmental constraints, and jurisdictional boundaries.
Portfolio Visibility Across All Projects
Portfolio dashboards show every well's health at a glance with color-coded status. Identify which projects need attention without waiting for Friday's status meeting. Problems surface when they start, not days later.
Oil & Gas Teams Using Matidor


.webp)


Real Results from Real Operations

Surge Energy Case Study

Rife Case Study

Karve Case Study
Oil & Gas Operations Using Matidor
Well Abandonment Programs
Operations manager oversees 50 well abandonments across two regions over 18 months. Multiple contractors manage different wells. Budget is firm. Regulatory compliance is mandatory.
Before Matidor: Spreadsheets track each well. Consultant timesheets arrive daily via email. Finance consolidates costs monthly, discovering overruns after invoicing arrives. Asset locations and regulatory zones tracked in separate GIS system. Status meetings take 90 minutes because everyone references different spreadsheets.
With Matidor: Each well becomes a project with standardized phases. Contractors submit timesheets and progress updates through mobile. Real-time budget dashboards show spending against allocations. Alerts trigger when costs approach limits. All wells display on interactive maps with regulatory zones, right-of-way corridors, and asset disposition overlaid. Monthly reports generate in minutes.
Result: Budget control improves. Monthly close time reduces substantially. Status meetings become more efficient. Complete asset visibility with regulatory context on one map.


Pipeline Integrity Programs
Operations manager oversees inspection of 500 kilometers of pipeline across remote areas with zero cellular coverage. Multiple consulting firms conduct inspections across various regulatory jurisdictions.
Before Matidor: Paper forms collected at remote sites. Data manually entered after crews return. Budget tracking happens quarterly through invoicing. Pipeline segments, compliance zones, and inspection history tracked in separate systems.
With Matidor: Inspection forms load offline on mobile devices. Crews work completely offline in remote corridors. Data syncs when connectivity returns. Real-time budget tracking shows spending per crew. All pipeline segments display on maps with regulatory zones, environmental constraints, and right-of-way boundaries overlaid. Inspection history visualized geographically by segment and date.
Result: Inspection cycles complete faster. Budget stays controlled. Regulatory submissions happen more efficiently. Complete pipeline visibility with jurisdictional context.
Frequently Asked Questions
Most companies are operational within 4-6 weeks. The typical implementation timeline includes 2 weeks for discovery and configuration, 2 weeks for training and testing, then full deployment with dedicated onboarding support.
When consultants log time on mobile, those labor costs hit project budgets immediately within minutes of submission. Budget alerts trigger automatically at 70%, 90%, and 100% of allocation, giving you time to adjust spending before overruns occur. Traditional accounting systems update budgets only after invoicing completes (sometimes 5-7 days later).
[See how Budget and Cost Control works →]
Yes. Create contractor and partner accounts with role-based access restrictions. Contractors access only the specific projects they're assigned to without seeing your entire portfolio or sensitive financial data. All consultants submit work through the same platform in the same format.
[Learn more about Field Operations →]
All wells, facilities, and pipeline segments plot automatically on interactive maps with exact GPS coordinates. Layer multiple data types on the same map: asset disposition, regulatory zones, right-of-way corridors, environmental constraints, and jurisdictional boundaries. Color-code sites by project status (active, completed, planned), project type, or compliance requirements. Toggle layers on and off to focus on what matters for each decision.
[See how Location Intelligence works →]
All consultant work products stay in the centralized system with complete attribution, timestamps, and version history. Assessments, recommendations, photographs, test results, regulatory correspondence, and site documentation all remain in the project permanently.
[Learn more about Project Management →]
Create AFE budgets with detailed cost category breakdowns, track actual costs in real-time as consultants and contractors log expenses, receive automated alerts at configurable thresholds (typically 70%, 90%, 100% of AFE), generate variance reports comparing actuals to AFE, and maintain complete audit trails for regulatory reporting.
Yes. Configure separate budget structures and cost categories for capital expenditures and operating expenses, track spending against different accounting codes, report on CAPEX and OPEX separately or combined, and integrate with accounting systems to maintain alignment with financial reporting requirements.
Generate compliance reports with embedded maps and documentation, track regulatory deadlines with automated reminders, maintain audit-ready documentation with GPS-tagged photos and timestamps, export data in formats required by regulatory agencies (AER, provincial regulators), and store historical compliance data for multi-year reporting requirements.
Yes. Create custom fields for well status (active, suspended, abandoned, reclaimed), track asset disposition changes with complete history and timestamps, visualize wells on maps color-coded by status or disposition, generate reports showing status changes over time, and maintain documentation supporting regulatory filings.
Assign contractors to specific wells or project phases, grant role-based access so contractors see only assigned work, standardize data submission through unified forms and workflows, track contractor costs separately by well and phase, consolidate multi-contractor data automatically without manual reconciliation, and maintain contractor work product documentation.
See Matidor in Action With Your Projects
Schedule a Discovery Call
Schedule a 30-minute personalized demo. We'll walk through your specific workflows: how your consultants would track time, how budget alerts would prevent month-end surprises, how field data collection would work at remote sites, how geographic visualization would show assets with regulatory context.
You'll See:
- Your actual well locations on interactive maps with regulatory zones and right-of-way.
- How real-time budget tracking could help prevent budget overruns.
- Your consultant workflow translated into mobile forms that sync automatically.
- How portfolio dashboards could give you visibility into all projects.
Or Start Free for 14 Days
Get full platform access immediately. Import your current projects. Test mobile apps with your field crews. See real results with your own data.
- Full access to all platform features
- Live chat support during trial
- No credit card required
- Cancel anytime