Visualize Your Portfolio Geographically, Not Just Alphabetically
Interactive maps show where projects are, what regulatory zones apply, and how assets cluster geographically. Because proximity matters when coordinating field operations.

Overview
Alphabetical project lists hide critical operational patterns. Well Site A and Well Site B might be alphabetically distant but geographically adjacent, perfect candidates for crew coordination. Asset locations and regulatory zones tracked separately make planning incomplete. Matidor's Location Intelligence maps your entire portfolio geographically with multi-layer visualization. See all wells, facilities, or sites on one interactive map. Layer asset disposition, regulatory zones, right-of-way corridors, and environmental constraints. Color-coded status shows project health. Geography becomes your operational advantage.
Teams Visualizing Their Portfolio Geographically Rely on Matidor


.png)


.png)


Map Your Operations with Complete Geographic Context
Interactive Mapping and Visualization
- Real-Time Project Mapping: Display all project and site locations with automatic status updates as work progresses.
- Multi-Layer Mapping: Layer assets, regulatory zones, right-of-way corridors, environmental constraints, and jurisdictional boundaries on one map.
- Status-Based Visualization: Color-code sites by project status (active, completed, planned), type, or compliance requirements.
- Multiple Basemaps: Switch between Satellite, Road, Dark, and Light maps for different use cases.
- Vegetation Management: Visualize all right-of-way segments with regulatory clearance zones, environmental constraints, and species-at-risk areas on one corridor map. Track multi-crew progress in real-time and spot missed services before deliverables are due.

GIS Integration and Data Import
- Integration with GIS Databases: Connect to live GIS data using Web Mapping Services (WMS) for real-time authoritative data.
- Import GIS Layers: Import custom layers in KMZ, Shapefile, or CSV formats (property boundaries, infrastructure, regulatory zones).
- Export Map Drawings: Export maps in KMZ format for use in Google Earth or other GIS databases
- Toggle Subproject Layers: View multiple project layers simultaneously for spatial analysis.
Map Tools and Analysis
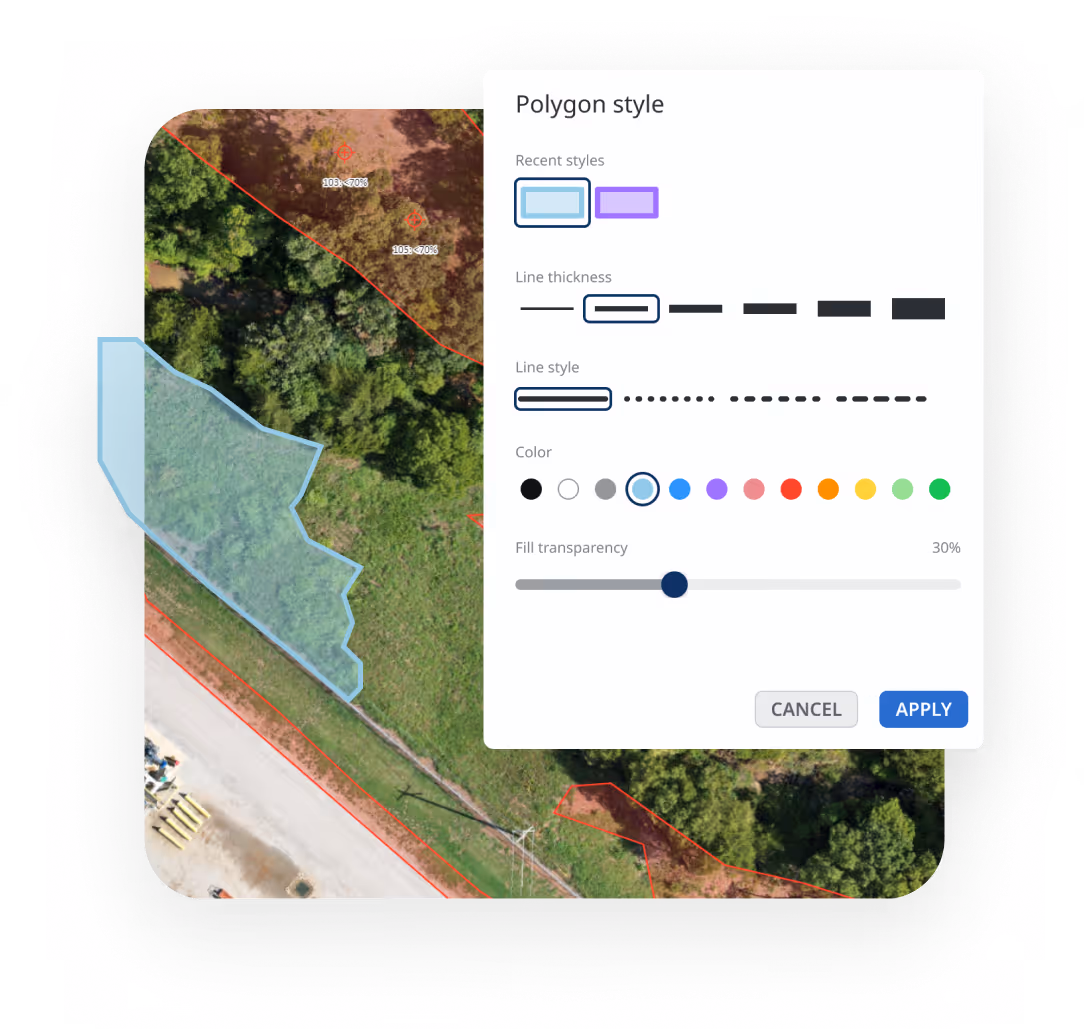
- Drawing and Measurement Tools: Select groups with lasso tool, measure distances and areas, set buffer zones around assets.
- Search and Filter: Find any drawing or location instantly using powerful search and filtering.
- Dynamic Styling: Icon styles update automatically based on task status or form conditions.
- Offline Map Viewing: Download maps for offline access before heading to remote sites.
.avif)
.avif)
Field Integration
- Geotagged Tasks and Forms: Pre-assign tasks with map icons, automatically mark locations as work completes.
- GPS Photo Documentation: Photos captured in field plot automatically on maps with timestamps.
- Historical Work Visualization: See where past projects were completed by date range, type, or outcome.
- Printable PDF Reports: Generate compliance documentation and client presentations with embedded maps.
Integrated with Matidor's Platform

Field Operations Integration
Photos, GPS coordinates, and inspection data collected through mobile apps automatically plot on your maps. Field teams see their location relative to assigned sites.
Learn more about Field Operations →
Project Management
Every project appears on the map automatically with real-time status updates. Track timelines, task completion, and team assignments geographically.
Learn more about Project Management →
Budget Tracking Integration
Visualize project costs geographically to see which locations consume the most resources. Make budget allocation decisions with complete spatial context.
Learn more about Budget and Cost Control →
Operational GIS Without the Complexity
Key Advantages
- No GIS expertise required: Project managers visualize portfolios without technical training
- Auto-updates from workflows: Map status changes as field teams complete work
- Business context built in: See budget health and task completion geographically, not just pins on a map
- Offline capability: Download maps before heading to remote sites
- Included with platform: No separate GIS software or licensing costs

Location Intelligence by Industry
Oil and Gas
Asset Visualization with Regulatory Context
Operations manager oversees 75 wells across two regions. Asset locations, well disposition, regulatory zones, and right-of-way tracked in separate systems. Planning incomplete.
With Matidor: All wells, facilities, and pipelines plot on interactive maps. Layer asset disposition, regulatory zones, right-of-way corridors, and environmental constraints. Color-code by project status. Toggle layers to focus on specific decisions.
Result: Complete asset visibility with regulatory context. Better planning coordination. Faster compliance documentation.
Environmental Services
Multi-Site Assessment Portfolio
Firm manages 30 environmental assessment sites across multiple jurisdictions. Site locations and regulatory zones tracked separately. Geographic patterns invisible.
With Matidor: All assessment sites plot with color-coded status. Layer regulatory requirement zones, property boundaries, and contamination areas. Filter by assessment phase or compliance status. See complete geographic context.
Result: Portfolio-level site visibility. Regulatory zone awareness. Coordinated multi-site inspections.
Learn more about environmental services solutions →
Multi-Site Operations
Infrastructure Visibility
Operations director oversees distributed infrastructure across multiple states. Asset locations tracked in spreadsheets. Service territories and jurisdictional boundaries separate.
With Matidor: All infrastructure displays on maps with service territories, regulatory jurisdictions, and operational zones overlaid. See complete geographic context for planning and coordination.
Result: Infrastructure visibility with service context. Better resource allocation. Improved coordination.
Learn more about solutions for other industries →
Teams Using These Capabilities

Project Forest Case Study

West Country Case Study

Peyto Case Study
Frequently Asked Questions
Location intelligence visualizes your entire project portfolio geographically on interactive maps with regulatory context. Instead of managing locations in spreadsheets, Matidor plots every project and asset on a map with multi-layer visualization showing regulatory zones, right-of-way corridors, environmental constraints, and jurisdictional boundaries. This helps you understand spatial relationships, plan with complete geographic context, and coordinate resources based on proximity and regulatory requirements.
Yes. Import address lists, coordinate data, or GIS layers in CSV, KMZ, or Shapefile formats. The system automatically geocodes addresses and plots locations. Import authoritative regulatory data using WMS connections. Bring in years of historical project data to visualize your complete service area.
Projects created in Project Management appear on maps automatically. Photos and GPS coordinates from Field Operations mobile apps plot instantly. Project costs from Budget and Cost Control display geographically. This integration eliminates manual data transfer and ensures your map reflects current operations.
Yes. Download maps for offline access before heading to remote sites. Field teams view project locations, property boundaries, regulatory zones, and task assignments without connectivity. GPS location tagging works completely offline with automatic sync when connection returns.
Yes. Import regulatory boundary layers, environmental constraint zones, right-of-way corridors, or any geographic data in standard GIS formats. Toggle layers on and off to see how projects intersect with regulatory jurisdictions. This supports compliance planning and audit documentation.
GPS coordinates are accurate within 5-10 meters in open areas. For critical compliance work, import authoritative boundary data from regulatory agencies using WMS connections. All location data includes timestamps and user attribution for complete audit trails.
Yes. Export maps as PDF reports showing project locations, regulatory zones, and work distribution. Generate custom map views showing only relevant data layers. Control exactly which information appears in each view to protect sensitive data.
Project locations update in real-time. Create a new project and it appears on the map immediately. When technicians mark work complete or upload photos, map markers update automatically. Status changes sync instantly across all users.
Import KMZ, Shapefile (SHP), CSV with coordinates, and connect to live data using Web Mapping Services (WMS). Export maps and drawings as KMZ for use in Google Earth, ArcGIS, or other GIS software. Standard coordinate systems include WGS84, NAD83, and local projections.
Yes. Built-in measurement tools calculate distances between points, perimeter measurements along paths, and area calculations for polygons. Measurements support multiple units (kilometers, miles, meters, feet, acres, hectares) and account for terrain elevation when needed.
Generate PDF map reports showing selected projects, layers, and geographic context. Control exactly which information appears in each report to protect sensitive data. Alternatively, grant external stakeholders view-only access to specific map layers through secure client portals.
Matidor provides operational GIS capabilities including proximity analysis, buffer zones around assets, multi-layer filtering, and geographic queries. For advanced spatial analysis (geostatistics, network analysis, 3D terrain modeling), export data to specialized GIS tools like ArcGIS or QGIS.
See Matidor in Action With Your Project Data
See Your Portfolio on the Map
Schedule a 30-minute demo. We'll show you how to visualize your specific portfolio with regulatory zones, asset disposition, and right-of-way corridors in complete geographic context.
You'll See:
- Your assets and projects displayed on interactive maps
- Multi-layer visualization with regulatory zones and infrastructure context
- How field data flows automatically to map visualization
- Geographic coordination workflows for your operations
Or Start Free for 14 Days
Get full platform access immediately. Import your project locations and GIS layers. See your portfolio with complete geographic context.
- Full access to all mapping features
- Live chat support during trial
- No credit card required
- Cancel anytime