Abandonment and Reclamation Software in Action: How Peyto Replaced Spreadsheets with Matidor
Company: Peyto Exploration and Development Corp.
Industry: Oil and Gas, Abandonment, Reclamation and Asset Retirement
Contact: Anthony Traverse, Senior Environmental Analyst (Abandonment and Reclamation Coordinator)
Location: Calgary, Alberta, Canada
See how Matidor works for oil and gas abandonment and reclamation teams.


The Company
Peyto Exploration and Development Corp. (TSX: PEY) is one of Canada's leading unconventional natural gas producers, operating extensively across Alberta's Deep Basin. In 2023, Peyto completed a strategic acquisition of Repsol Canada Energy Partnership — a transaction valued at approximately $636 million CAD — that expanded the company's land holdings by 455,000 net acres and significantly increased its asset retirement obligations.
This acquisition created an immediate operational challenge. Peyto now needed to manage a substantially larger portfolio of abandonment and reclamation projects, coordinate multiple consultants, track costs across dozens of well sites, and ensure regulatory compliance with the Alberta Energy Regulator.


A Spreadsheet Problem at Scale
Before adopting Matidor, Peyto's abandonment and reclamation team managed project data through Excel spreadsheets. What had worked at a smaller scale became unworkable after the acquisition dramatically expanded the complexity of the reclamation portfolio.
The team faced three compounding problems:
- No real-time visibility into project costs. Consultant costs, budget tracking, and expense data were scattered across static files. By the time discrepancies surfaced, it was often too late to course-correct before budget thresholds were crossed.
- Fragmented consultant management. Coordinating multiple external consultants — each submitting updates through email, spreadsheets, or paper forms — created inconsistent data, miscommunication, and reporting delays.
- No centralized project tracking. With well sites spread across Alberta, there was no single view of project status, site locations, cost codes, or outstanding tasks. Team members had to manually gather updates from multiple sources daily just to understand where projects stood.
Why Matidor
Generic project management tools lacked budget integration and geographic visualization. Enterprise ERP systems were too complex and slow to deploy. Matidor offered something purpose-built: a GIS-native field operations platform designed for multi-site programs such as oil and gas abandonment and reclamation.
Matidor's features mapped directly to Peyto's needs:
Real-time cost tracking
Centralized project visibility
GIS site mapping
Consultant coordination
Reporting
The Solution in Action
Portfolio and Project Management
With Matidor, the team moved from static spreadsheets to a live project management dashboard. All abandonment and reclamation sites appear on a single portfolio map, with color coding by status, priority, or any custom field the team configures. Centralized communication and standard workflows have replaced scattered email threads and inconsistent processes.

Budget and Cost Control
Matidor's budget and cost control module transformed how Peyto tracks consultant spend in real time. Each project has budgets with specific cost codes, and the platform automatically generates accrual reports, replacing a process that previously required days of manual consolidation at month-end.Automated email alerts at 70%, 90%, and 100% of budget give the team advance warning before overruns occur, instead of finding out only when invoices arrive.
Power BI Integration: Real-Time Cost Visibility Across the Portfolio
For Peyto's leadership and finance team, Matidor's data does not stop at the project dashboard. The team connected Matidor to Microsoft Power BI to build filter-driven executive dashboards that display cost versus budget performance across the entire reclamation portfolio in real time.
Before this integration, reporting on portfolio-wide financial performance required manually pulling data from spreadsheets, consolidating it, and building static charts — a process measured in days. With Matidor feeding live project and budget data into Power BI, target gauges and variance charts update automatically as field costs flow in. Finance and leadership can filter by site, consultant, cost code, or date range and get an immediate view of where the program stands against budget, without waiting for month-end reconciliation.


Location Intelligence and GIS Mapping
Before Matidor, well site data and regulatory context lived in a separate GIS system that did not connect to project management tools. With Matidor, site maps, regulatory overlays, and live project data sit in one place, giving the team both spatial and financial context for every site.
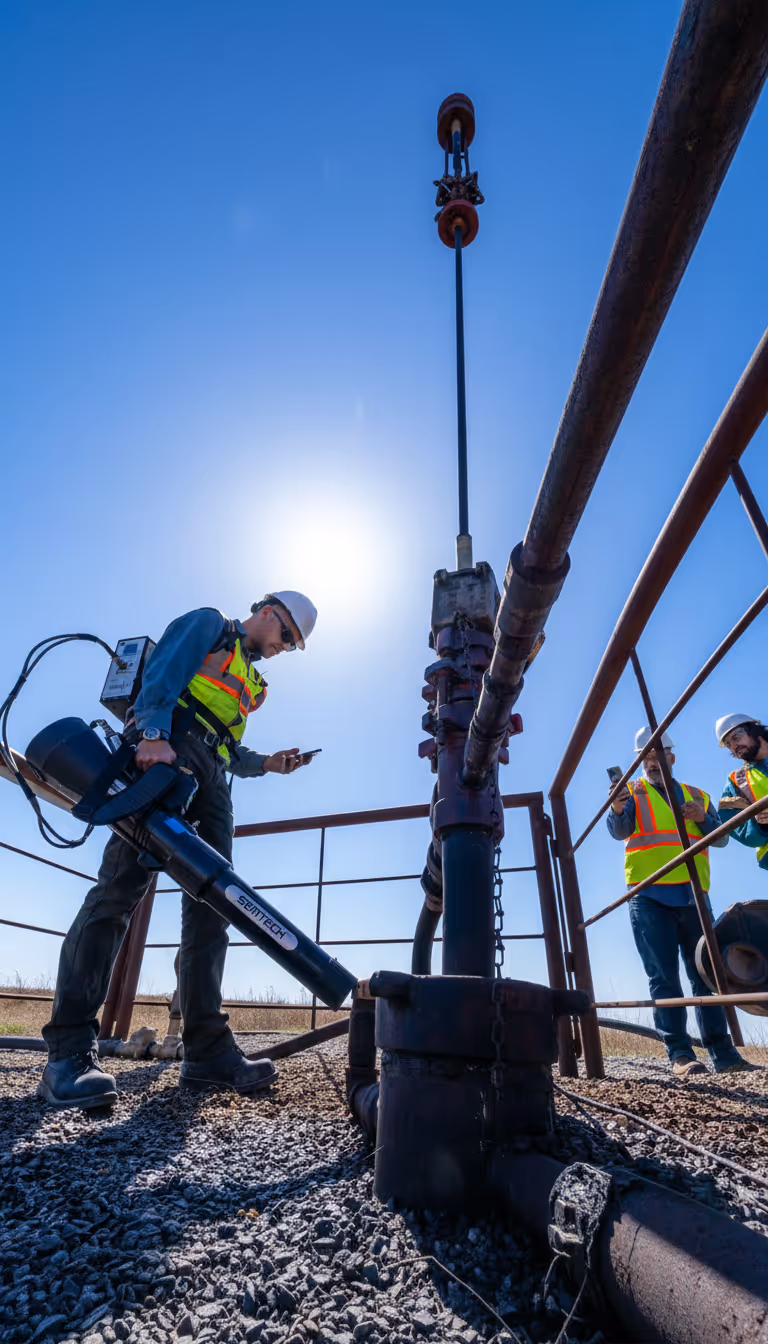
Field Operations and Mobile Data Capture
Field crews rely on Matidor's mobile field operations app for on-site data collection. They capture photos, notes, and status updates on location and sync back to the office when coverage is available, removing paper-based forms and delays caused by poor cell reception.


Results and Impact
Key improvements across the program:
- Faster reporting. Portfolio dashboards and automated reporting templates replaced manual Excel builds for status updates and month-end accruals, reducing what previously took days to a same-day process.
- Fewer errors. Real-time field data entry cut transcription mistakes that were common with paper forms and email-based updates.
- Greater throughput with the same team. Streamlined project coordination freed the team to manage a larger post-acquisition workload without adding headcount.
- Map-led decision making. A single live map of all sites replaced cross-referencing multiple systems, giving coordinators an immediate view of overall program status.
- Stronger consultant accountability. Consultants receive tasks inside Matidor, submit updates in the platform, and progress is visible instantly for the office team.
Related Customer Stories