
The core problem with how environmental consultants use GIS today
Most environmental consulting firms use GIS. Few use it as a project management system.
The typical setup separates these two functions entirely: ArcGIS or QGIS handles spatial analysis and map production, while spreadsheets, email, and general-purpose project tools handle everything else, including task assignment, budget tracking, field data collection, and status reporting. The result is a workflow that runs in parallel tracks that never fully connect.
This gap matters because environmental project work is inherently spatial. A contamination site assessment is not just a set of tasks to complete on a schedule. It is a set of actions tied to specific physical locations, each of which has its own sample targets, regulatory boundaries, cost codes, and completion status. When the spatial record lives in ArcGIS and the project record lives in a spreadsheet, every update requires manual reconciliation between the two.
The firms that have closed this gap are not running more sophisticated GIS software. They are running GIS-native project management platforms where the map is the project record, not a separate deliverable.
What GIS-native project management actually means
A GIS-native platform is built around the map as the primary interface, not a reporting layer added on top of conventional project management tools.
In a conventional setup, a project manager opens a spreadsheet or task board to see what work is outstanding, then separately opens a GIS application to understand where that work is located. Two systems, two logins, and any update made in one does not automatically appear in the other.
In a GIS-native platform, every task, form submission, cost entry, photo, and status update is attached to a location and appears on the map automatically. A project manager overseeing 20 active contamination sites can see at a glance which sites have open field activities, which are tracking over budget, and which have outstanding regulatory deliverables, without switching applications or compiling a status report.
This distinction matters most at program scale. Managing a single site with a spreadsheet is difficult but manageable. Managing 30 active sites across a regional portfolio using disconnected tools creates compounding visibility gaps that no amount of manual effort fully resolves.
Where the spreadsheet-and-GIS split breaks down
Site planning without spatial context
When project scope is planned in a spreadsheet, field crews receive a task list with location references, a site name, a GPS coordinate, a map attached to an email. The actual planned sample locations, lease boundaries, and spatial extents of the scope do not travel with the task.
In the field, this means technicians are navigating to a general site area rather than to precisely defined sample points. Work outside the intended scope boundary is not caught until post-processing, when the data has already been collected and the crew has already left.
When planning happens directly on the map with polygons drawn, sample targets placed, and boundaries defined, field crews navigate to exact locations and the system validates that data is collected within the intended scope.
Budget tracking that lags the work
The standard approach to environmental project budgeting involves field tickets or time sheets submitted at the end of the day or week, reconciled against the project budget by an office administrator, and reviewed by the project manager when the reconciliation is complete. By the time a cost issue is visible, it has often been accumulating for several days.
Real-time cost tracking requires daily entries tied directly to project and scope codes, with automatic aggregation visible to the project manager as entries are submitted. When field personnel and office staff both enter costs and time in the same platform where the site work is being managed, the budget view is always current.
Field data that arrives without structure
Handwritten borehole logs, GPS files exported from a field device, photos stored in a personal camera roll, and notes emailed from the field are all forms of field data. None of them arrive as structured, queryable records.
Digitizing and organizing this material into a usable project record takes significant time, introduces transcription risk, and creates a lag between when data is collected and when it is available to the project manager. When field crews submit data through structured digital forms tied to specific site locations, that lag disappears and the data quality problem is addressed at the point of capture.
Spatial errors found in post-processing
On projects with hundreds of sample points, numbering errors and location mismatches are common. A technician collects from sample point 47 when they were supposed to collect from sample point 74. A sample is collected outside the permitted boundary. A duplicate is collected from a location that was already sampled by another crew member.
These errors are only visible when the data is loaded into a GIS application and checked against the planned sample locations, a step that happens in the office, after the field crew has demobilized. The correction requires returning to site.
When field data is captured directly on a live map, these errors surface in real time. A sample plotted outside the expected boundary is immediately apparent to both the technician and the remote project manager.
What GIS-native project management requires in practice
A single layer that connects field and office
The map layer that field crews work with and the map layer that office staff and project managers review must be the same layer, updated in real time. Separate GIS files shared by email are not a substitute.
Forms and tasks tied to locations, not just projects
Task assignment in a GIS-native system attaches tasks to specific map locations. Field personnel see their assigned work as points or polygons on the map, navigate to the correct location, and submit structured forms that capture all required information before the task can be marked complete.
Required fields enforce data completeness at submission. A borehole log that is missing a depth reading or a soil classification cannot be submitted until those fields are populated, removing the need for post-submission follow-up.
Offline-first field access
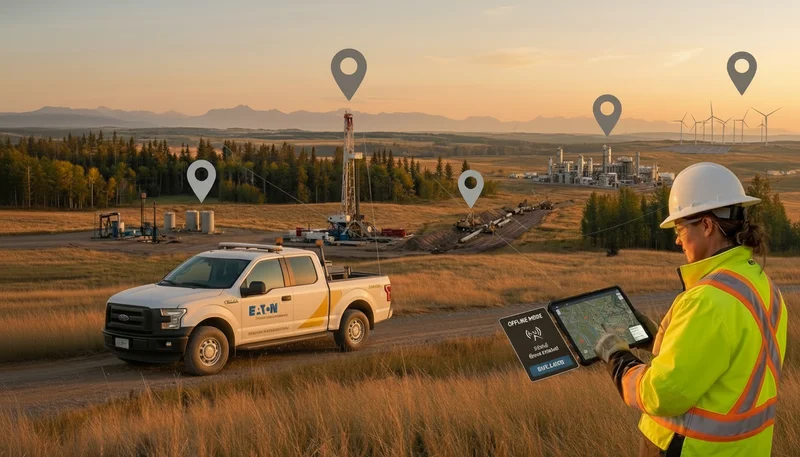
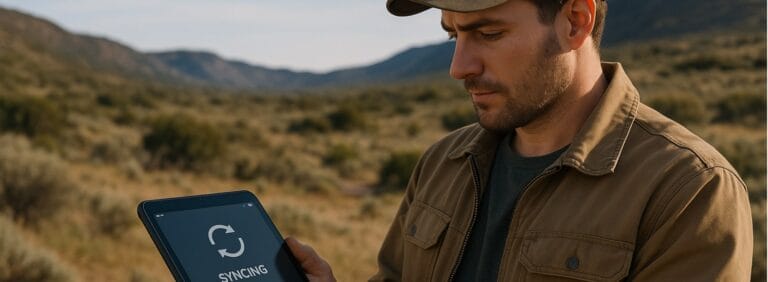
Most contamination and remediation sites are not in areas with reliable mobile data connectivity. A GIS-native platform built for environmental field work must operate fully offline, with automatic sync when connectivity is restored, GPS and timestamp recorded at point of capture, and photos attached to the record in the same step as the form submission.
Budget and spatial data in the same workspace
Separating spatial project management from financial tracking requires a reconciliation step that creates delay and introduces error. When cost codes, budget scopes, and time entries are managed within the same platform as site maps and field forms, the project manager sees the full project picture, including spatial progress, financial status, and data completeness, without switching tools.
How this applies across environmental project types
Phase II Environmental Site Assessments
Phase II ESAs involve planned sample locations, defined investigation boundaries, borehole logs, chain of custody documentation, and lab results that must be reconciled against spatial references. All of these elements benefit from spatial tracking. Sample locations planned on the map travel to the field with the task. Borehole logs submitted through structured forms arrive complete. Lab results linked to georeferenced sample points are immediately queryable without manual cross-referencing.
Remediation programs
Active remediation programs often run across multiple concurrent scopes, including investigation, treatment, monitoring, and reporting, at the same site or across multiple sites simultaneously. Tracking progress across these scopes in a spreadsheet requires constant manual aggregation. A GIS-native program view shows scope completion, open findings, and cost status by location, giving operations managers the portfolio visibility they need without weekly status calls.
Long-term monitoring
Monitoring programs run for months or years, with recurring field visits to established monitoring points. Historical data from previous visits must be accessible when a technician returns to a monitoring location. A spatial record that attaches all previous readings to a georeferenced point makes trend analysis immediate and removes the need to search across multiple spreadsheet files or database exports.
What to look for in a platform
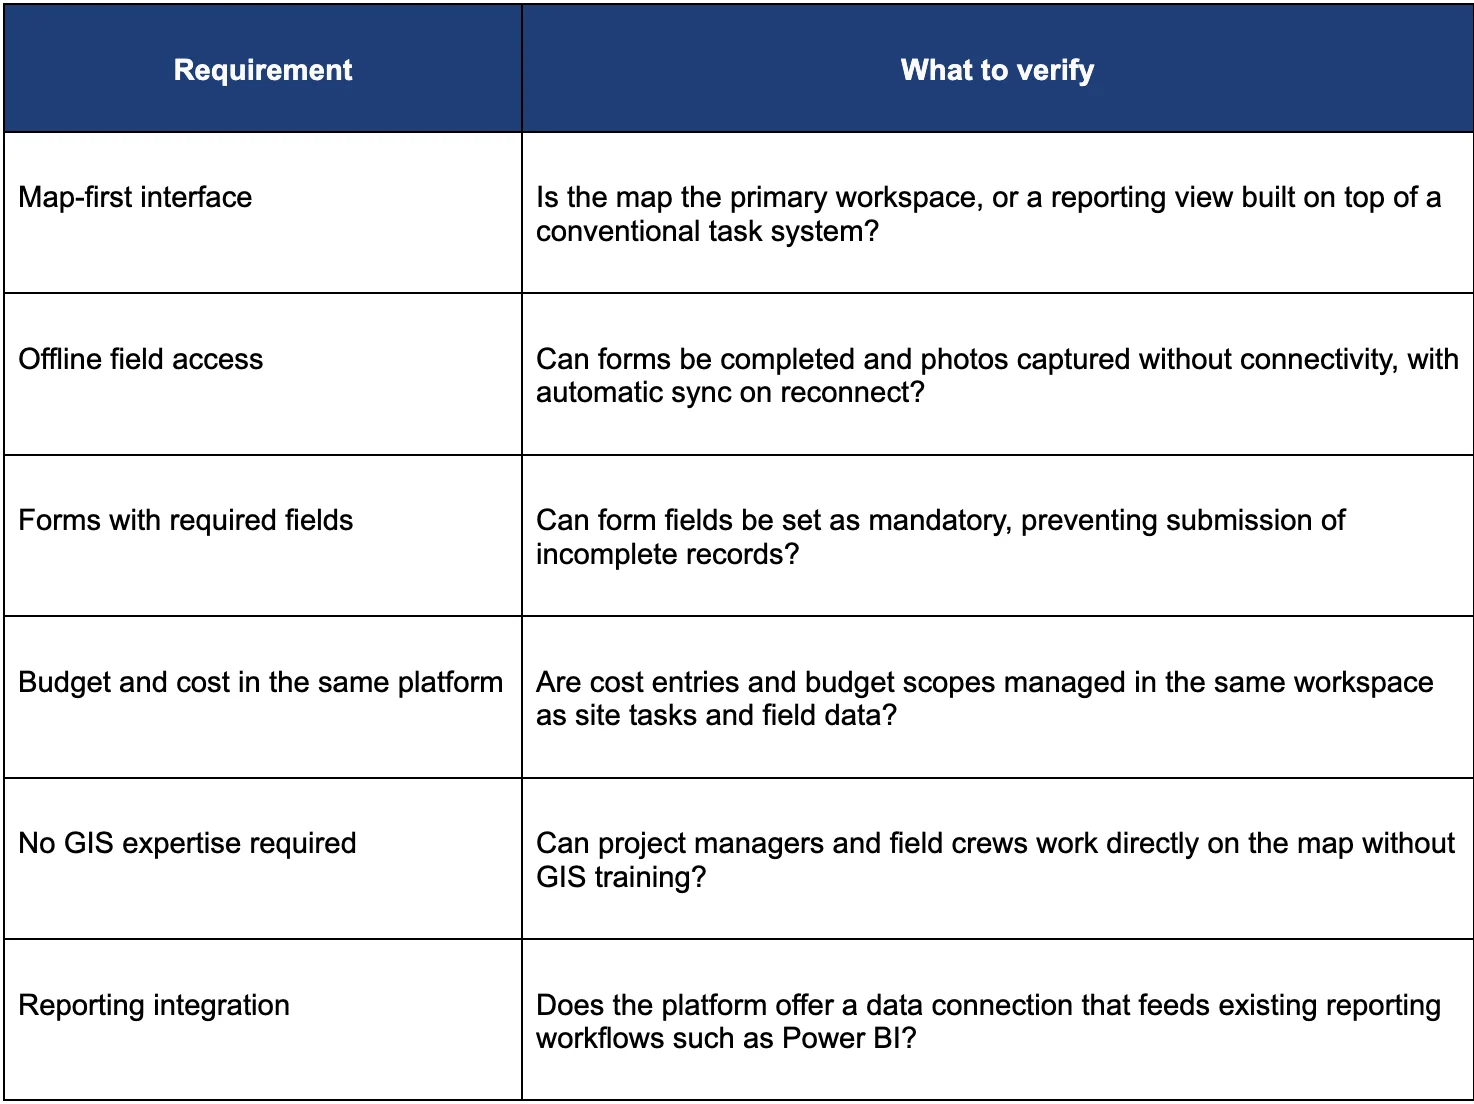
The distinction between a GIS tool and a GIS-native project management platform is not technical sophistication. It is whether the map is where the work is managed or merely where the work is displayed after the fact. For environmental consulting firms managing multi-site programs with concurrent scopes, field crews, and active budgets, that distinction determines whether the project record reflects what is actually happening in the field.
Frequently Asked Questions
What is the difference between a GIS tool and a GIS-native project management platform?
A GIS tool such as ArcGIS or QGIS is designed for spatial analysis and map production. A GIS-native project management platform is built around the map as the primary workspace for managing active projects, meaning tasks, forms, cost entries, and field data are attached to map locations and updated in real time. The distinction is not technical sophistication. It is whether the map is where the work is managed or where results are displayed after the fact.
Why do environmental consulting firms need GIS in their project management workflow?
Environmental project work is inherently spatial. Sample locations, lease boundaries, investigation extents, and monitoring points all have specific geographic coordinates that define where work must be done and whether it was done correctly. When project management happens in a tool that has no spatial awareness, field crews navigate to approximate locations, scope boundary violations are not caught until post-processing, and spatial errors require returning to site to correct. GIS-integrated project management ties every task, form, and cost entry to a specific location, which eliminates the reconciliation step between where the work was planned and where it was executed.
What GIS expertise does a project manager need to use a GIS-native platform?
In a purpose-built GIS-native project management platform, no GIS expertise is required. Project managers define site boundaries by drawing polygons on the map, place sample targets by clicking on locations, and review field progress through a live map view without needing to understand coordinate reference systems, attribute tables, or spatial analysis functions. The GIS capability is embedded in the workflow rather than requiring a trained GIS professional to operate it.
How does GIS project management help with Phase II ESA compliance?
Phase II ESAs require sample locations to be precisely defined, borehole logs to be complete and traceable to specific coordinates, chain of custody documentation to match the spatial record, and lab results to be reconcilable against the planned sample grid. When all of this is managed in a GIS-native platform, sample locations planned on the map travel to the field with the task, structured forms enforce completeness at submission, and spatial validation catches location errors before crews demobilize. The result is a data package that does not require manual reconciliation before it can support a Phase II report.
Can a GIS-native project management platform replace ArcGIS for environmental work?
No. ArcGIS and similar GIS platforms are purpose-built for spatial analysis, modeling, and cartographic production, which remain part of most environmental consulting workflows. A GIS-native project management platform addresses the project coordination gap, connecting field data collection, task management, budget tracking, and real-time program visibility in a single workspace. The two tools serve different functions and are typically used together, with the project management platform handling field operations and the GIS platform handling analysis and deliverable production.
Ready to Run Environmental Projects on a Live Map?
For environmental consulting teams ready to close the gap between GIS and project management, Matidor's location intelligence and field operations tools are built specifically for this. GIS-native site management, offline-first mobile forms, automatic GPS and timestamp capture, and real-time budget visibility work together in one platform. See also Matidor's solutions for environmental services and project management.
Additional reading: How to Track Field Inspection Reports Across Multiple Sites and Field Operations Software Buyer's Guide.
- Start a free 14-day trial and run your first GIS-native field program in under a day
- Book a demo to see live map-based task management, offline mobile forms, and portfolio-level visibility configured for your sites
- Evaluate platform fit with Matidor's self-guided discovery tool
.webp)
.webp)
.webp)
.webp)
.webp)
.webp)
.webp)
.webp)
.webp)
.webp)
.webp)
.webp)
.webp)
%20(2).webp)
.webp)
.webp)
.webp)
















.webp)

.webp)

.jpg)

%20(1).webp)




.jpg)

.jpg)
.jpg)
.jpg)

.jpg)